
The Television Licence Fee's history

 Brian Butterworth published on UK Free TV
 In response to questions posted on another page, we calculated the cost of the BBC Licences over the years.
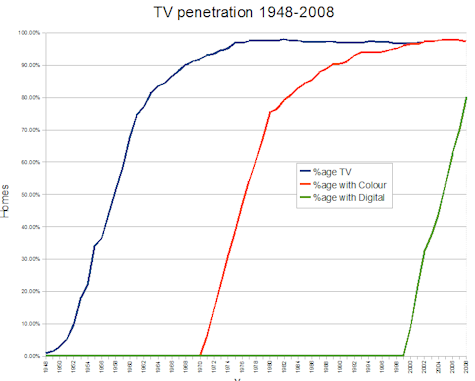
The first graph, however, shows the percentage of homes with a television, a colour television and finally digital television from 1946-2008.
 This main graph (click to view full size) shows the cost of the various licences, adjusted using the Retail Price Index to 2008 prices.
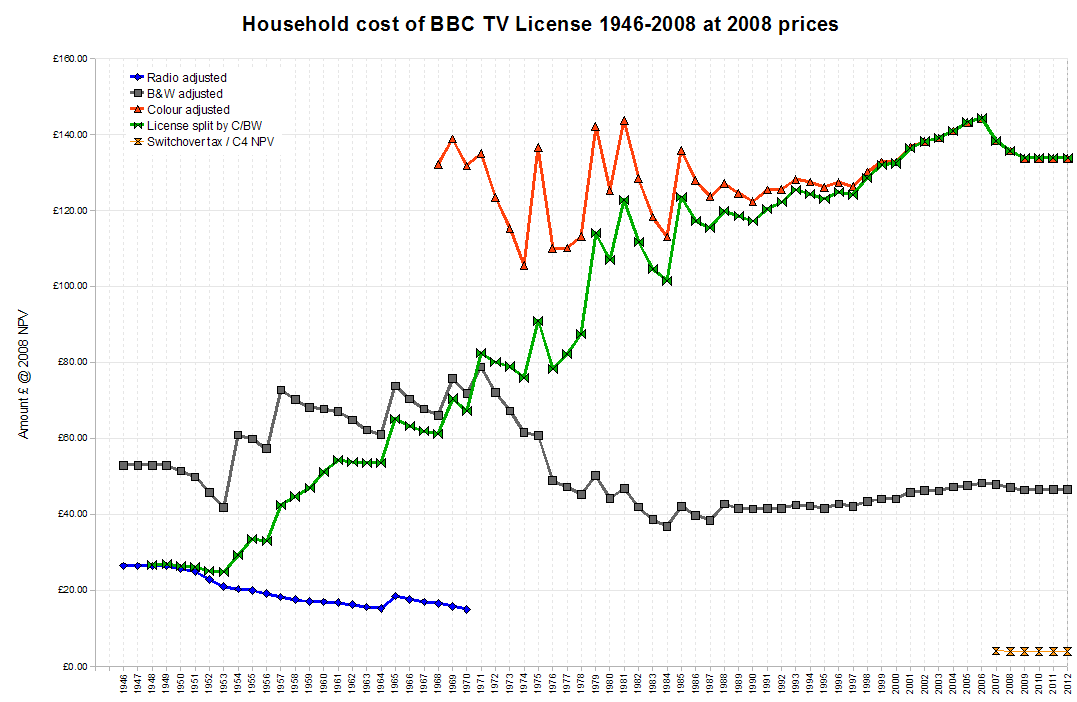
- The blue line show the cost of a radio licence - at 2008 prices - which ran from 1922 to 1970, shown here from 1946;
- the grey line shows the cost of a monochrome licence at 2008 prices from 1948 to today;
- the red line shows (as before) the cost of a colour licence at 2008 prices from 1968 to today. I have adjusted the value for 2007 and 2008 to take into account the orange line.
- The orange line shows the amounts collected as part of the TVL which does not go to broadcasters, but is used to supply funding for set-top boxes for those aged over 75 (and selected others).
- So taking into account ALL of the above, there is a GREEN LINE that takes into account the proportion of homes with radio, monochrome and colour television and creates an average amount that each household would pay.
- This line starts the same as the radio line, but meets the monochrome line by 1970 (when almost all homes had a TV) and then eventually joins the colour line by 2003 when almost all homes have a colour TV.
Help with TV/radio stations?
In this section