Transmitter map updates are coming - soon
 Brian Butterworth published on UK Free TV
 I am using a Amazon Elastic Compute Cloud (Amazon EC2) - High-CPU Extra Large Instance to perform the calculations more quickly than my own PC can manage and without slowing down the main UK Free TV server.
7 GB of memory, 20 EC2 Compute Units (8 virtual cores with 2.5 EC2 Compute Units each), 1690 GB of local instance storage, 64-bit platform
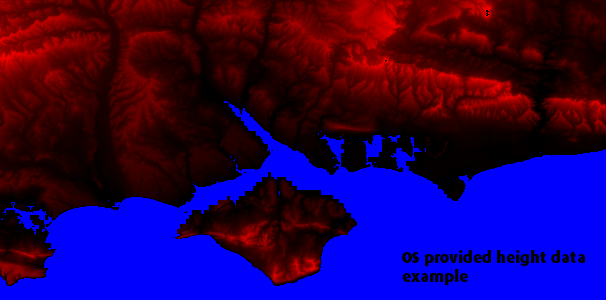
The first stage has been to import several sources of height information - including Ordinance Survey, which has resulted in a much more accurate. Here is an example - the level of brightness in the red has the height in meters encoded:
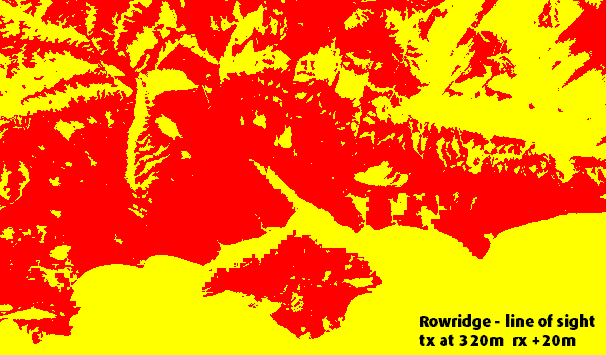
The second (and high CPU stage) which is operating at the moment, is to take each transmitter location and each operating height from each transmitter and calculate the locations where an aerial 10 meters above ground has a line-of-sight to the transmitter. Here is an example:
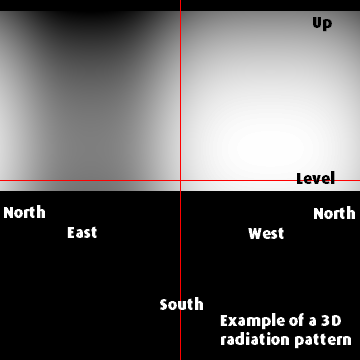
The next function is to take the 3D radiation patterns from the BBC FOI data and create maps of each of these, for example.
The next stage, which I hope will complete shortly, will be to combine all these bits of information into a single graphic for each multiplex from each transmitter.
Finally, I will change the interface on the mapping pages to allow viewing the coverage areas for each multiplex.
I am also considering adding the Saorview transmitters to the maps.
As usual, I will be interested in any comments.
8:47 PM
Nice work Brian,I will be keeping an eye on this part of the site.
Best wishes.
| link to this comment |
1:14 PM
Yes, I thing that you should add the Saorview Transmitters in Ireland, it would be useful for people living in Ireland
| link to this comment |
1:17 PM
Line of sight is not required for UHF television reception. It's recommended, because the UHF signals don't refract all that much, but they *do* refract over terrain and in some places that will be sufficient.
If signals didn't refract over roofs of neighbouring houses, very few people would be able to receive from terrestrial transmitters!
This refraction *also* contributes substantial amounts of interference from distant transmitters. The BBC's R&D white paper on planning states that Crystal Palace is a significant interferer over a square with edges 750km long:
BBC RD - Publications - White Paper 048 UK Planning Model for Digital Terrestrial Television coverage
That white paper describes how the prediction software for the UK Planning Model works. Digital UK's trade view is basically the output of the latest version of that software. A more detailed look at the algorithms can be found at:
http://downloads.bbc.co.u….pdf
http://downloads.bbc.co.u….pdf
http://downloads.bbc.co.u….pdf
(These are by J. Causebrook, the author of the PhD thesis referenced by that white paper.)
The amounts of refraction and reflection change over time with changes in weather conditions. Digital UK's predictions also take account of the statistical variation of signal strength and interference, across a grid square and over time.
| link to this comment |
Mike Dimmick: Thanks, as ever, for your comments.
I was using "line of sight" as shorthand, but I'm using the Earth Curvature Correction - Earth Curvature Correction .
I have read the above publications many times (thanks). I have been involved in the broadcasting business for quite some years, as I am sure you recall.
As I am using the official radiation patterns, I am trying to map out the provided information and not re-create the planning conditions to deal with troposcopic propagation and other events - I am trying to provide a simple map to show the service area for each transmitter.
Whilst it might be interesting to know over-the-radio-horizon predictions for weather conditions, I think that trying to present the information would present considerable confusion.
Another issue is the information displayed needs to not cause too much server load. I will probably be using another AWS machine to host the mapping displays and there is a limit to how much I can pay for this.
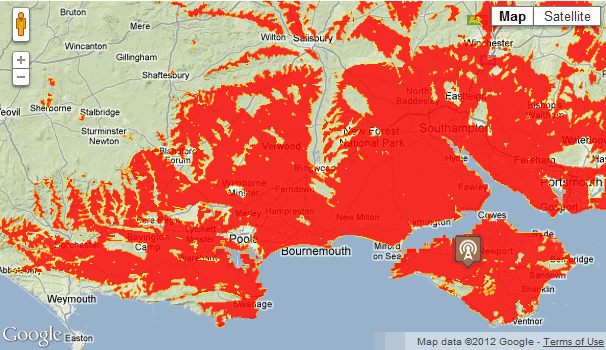
Anyway, the current state of the project is that it will display the interim data over the Google Maps correctly.
| link to this comment |
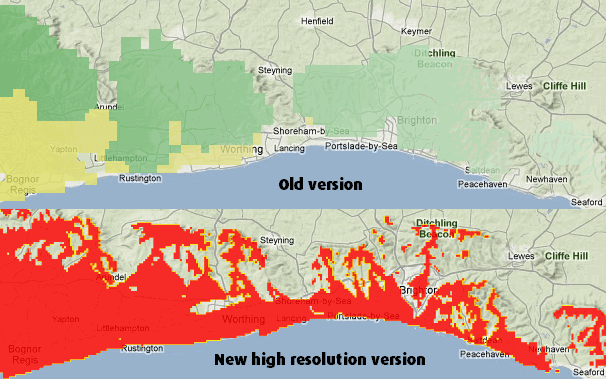
This example shows the improvement, due to having higher resolution data, around the coast:
| link to this comment |
10:14 AM
@Mike DImmick-I have two major hills on the way to Crystal Palace, I still get perfect quality on the intended Multiplexes. However, it reduces the strength to the point of barely hitting the threshold even with a stacked pair of Unix 100As.
| link to this comment |
5:48 PM
Scarborough
Great stuff Brian.
| link to this comment |
Phil's: mapP's Freeview map terrainP's terrain plot wavesP's frequency data P's Freeview Detailed Coverage
4:16 PM
Salisbury
excellent can see dead signal areas .Will the same be used for overlap maps.
| link to this comment |
david's: mapD's Freeview map terrainD's terrain plot wavesD's frequency data D's Freeview Detailed Coverage
david: Thanks very much. Yes, this will be for all maps - when it's all completed. The pages showing for Ireland (NI and RoI) now show the new overlay format - see Digital TV transmitters in Ireland - update | ukfree.tv - independent free digital TV advice .
| link to this comment |